Your Sample. Our Purpose.
Automation tailored to your workflow – not the other way around!
Don't miss out on any more news!
Sample Preparation
Automation for GC, GC/MS, LC, LC/MS, or standalone
Thermal desorption
Flexible and robust systems for GC/MS
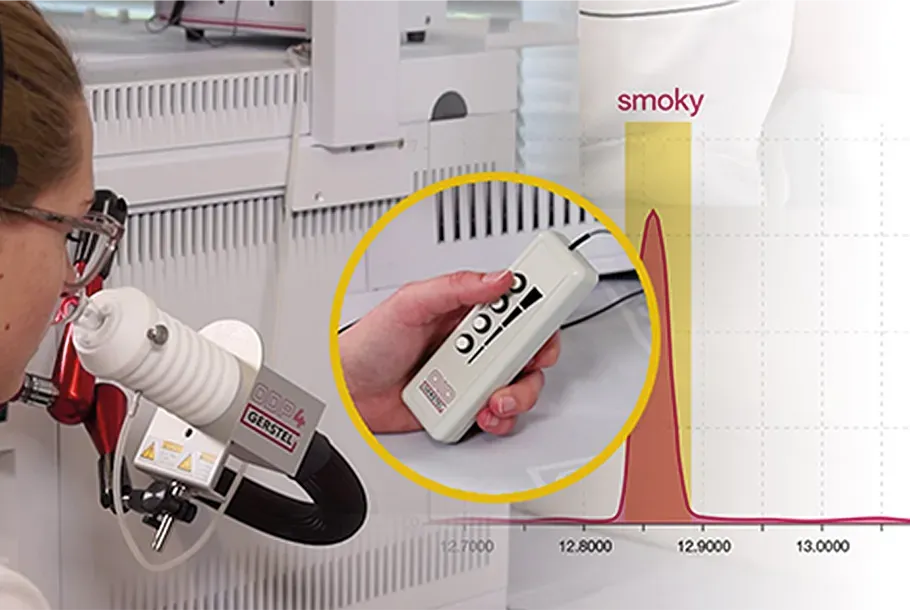
GC-Olfactometry
Detection of aromas, fragrances and off-odors
Personal contact
Direct, individual advice
News from GERSTEL
Webinar Series
Let Your Nose be Your Guide
Discover how the human sense of smell can add value to your chromatographic and mass spectrometric results.

Utilisation of stir bar sorptive extraction for the analysis of biogenic amines in wines

Sensory Directed Analysis Workshops in Germany, China and Singapore
New AppNote: Sensory-Active Compounds in Cannabis
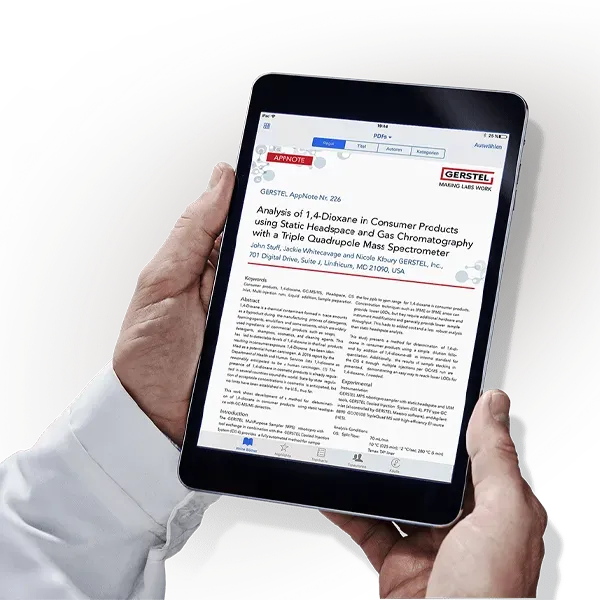
GERSTEL Applications
Background knowledge in a compact format: While our comprehensive AppNotes provide detailed analysis and technical guidance, the AppBriefs focus on presenting the most important insights and data in a clear, two-page format.
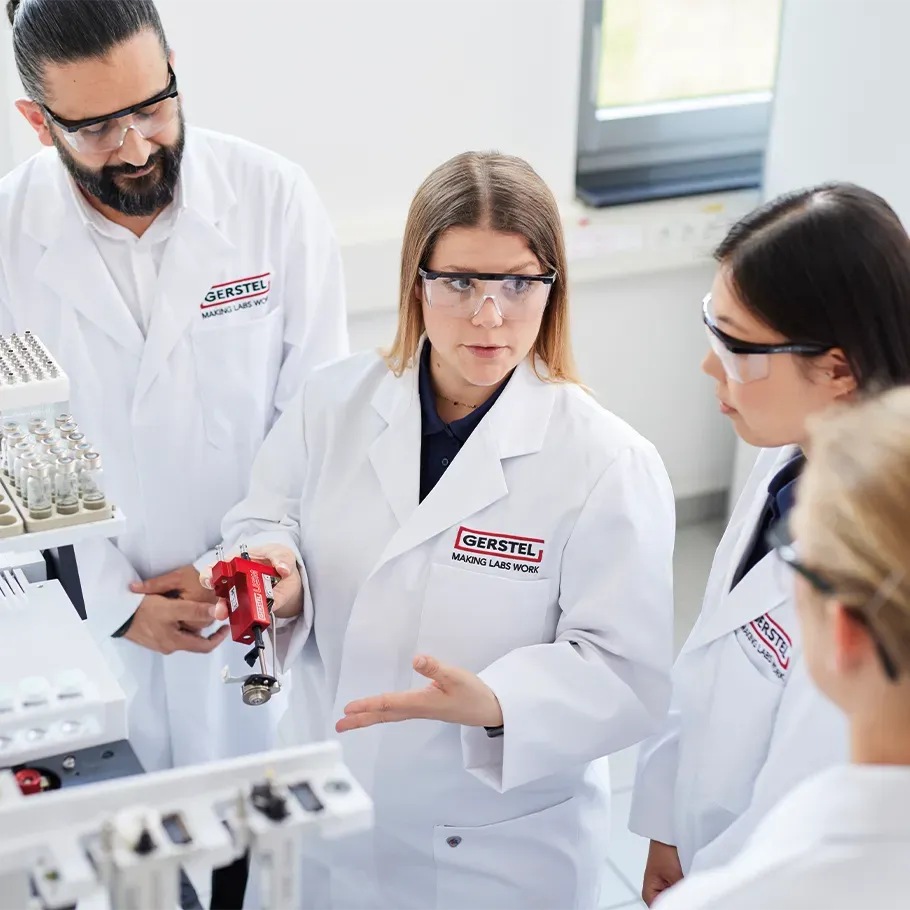
Experience GERSTEL
Our latest video